A March 2024 survey of nearly 3,300 students supports transition/exit programming for students nearly graduation. The survey was limited to those graduating within a year (Spring, Summer, Fall of 2024) and those staying in the United States after graduation. The initial, major findings are below.
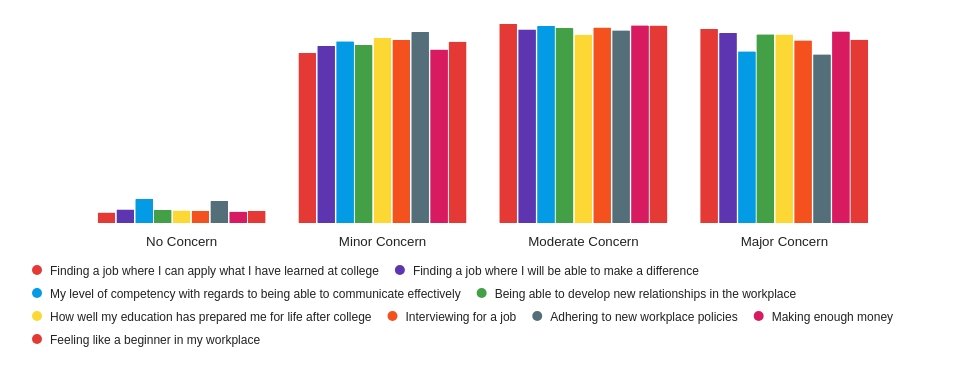
When thinking about graduation, how concerned are you about these factors relating to personal support?
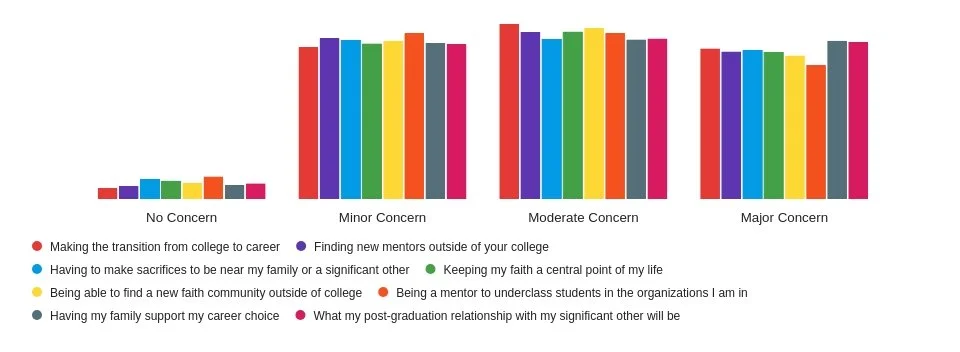
When thinking about graduation, how concerned are you about these factors related to change and loss?
When thinking about graduation, how concerned are you about these factors relating to personal support?

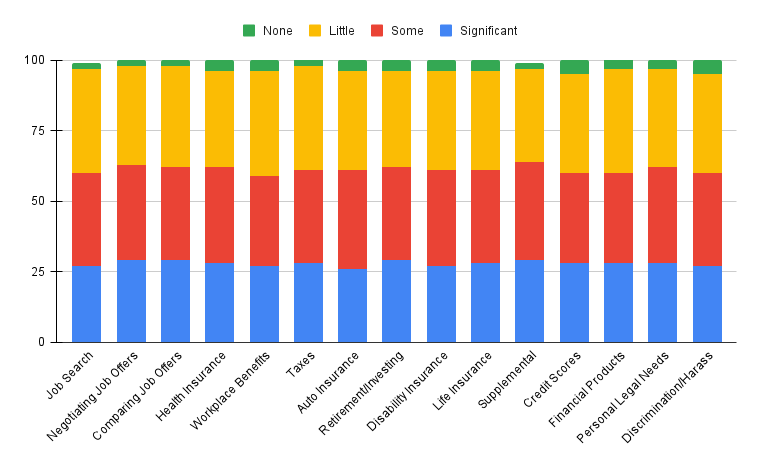
When asked about stress/anxiety specifically related to adulting topics, students responded:
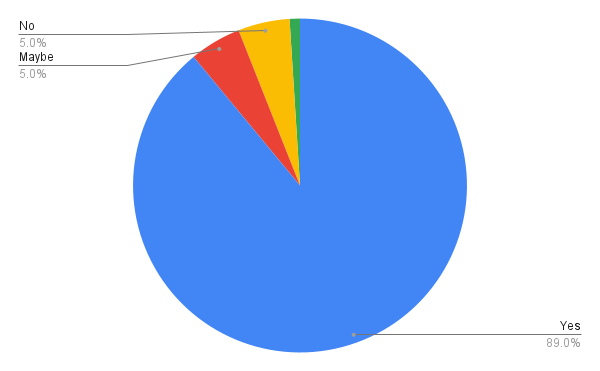
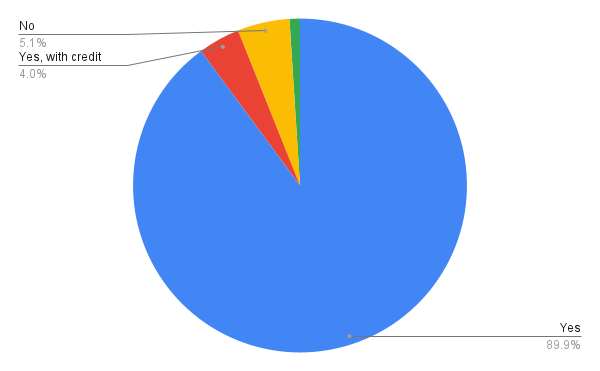
If your college offered a program that assisted you in understanding these adulting concepts, would you be interested?
If your college offered a program that assisted you in understanding these adulting concepts, would it reduce your stress/anxiety about graduation?